Project Quality Management
Project Quality Management includes the processes of the performing organization that determine quality policies, objectives and responsibilities so that the project satisfies the needs for which the project was undertaken. The four terms that are synonymous with Project Quality Management are Quality, Grade (category assigned to products or services having the same functional use but different technical characteristics), Precision and Accuracy. Project Management recognizes the importance of prevention over inspections, continuous improvement, and customer satisfaction.
The process involved in Project Quality Management are:
The process involved in Project Quality Management are:
- Plan Quality: The process identifies quality requirements for the projects and documents how the project will demonstrate compliance. Quality Planning should be performed in parallel with the other planning processes.
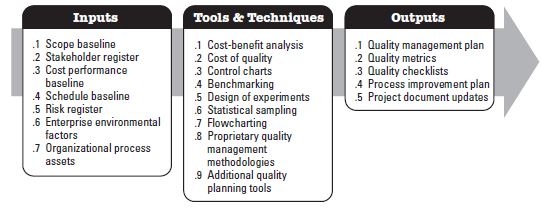
Inputs, Tools and Techniques, and Outputs for the process of Plan Quality
Tools and Techniques:
Cost of Quality (COQ): COQ includes all costs incurred over the life of the product – costs of achieving good quality or cost of poor quality. Cost of achieving good quality are investments made to prevent poor quality like giving Total Quality Management (TQM) to new employees in a company. It also includes appraisal costs which comprise costs of doing inspections or buying test equipment. Cost of poor quality is the cost for rework (failing to meet requirements). They are failure costs.
Outputs:
Quality Metrics: Quality Metrics is an operational definition that describes a project attribute and how the quality control will measure it. It also defines the tolerance which sets the allowable variations on the metrics.
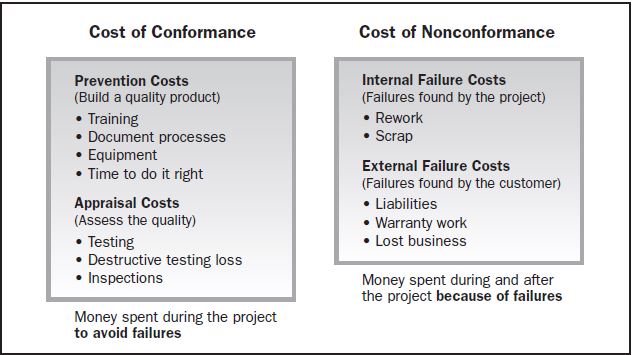
Costs of Quality
|
- Perform Quality Assurance: This process audits the quality requirements and the results from quality control measurements and ensures that appropriate quality standards and operational definitions were used. It lays down the basis for continuous process improvement. Continuous process improvement reduces waste and allows processes to be operated efficiently and effectively.
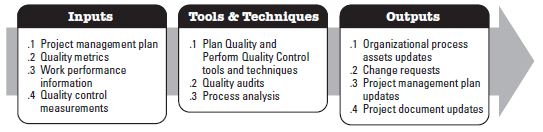
Inputs, Tools and Techniques, and Outputs for Perform Quality Assurance
- Perform Quality Control: It assesses performance and recommended necessary changes by monitoring and recording results of executing the quality activities. To help evaluate quality control outputs, the project team should have a working knowledge of statistical quality control. This process is performed throughout the project’s life cycle as prevention is always better.
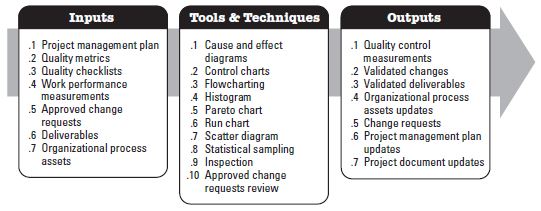
Inputs, Tools and Techniques, and Outputs for process Perform Quality Control
Tools and Techniques:
Cause and Effect Diagrams (Ishikawa): These diagrams present an effect/problem and the potential causes of the problem.
Pareto Chart: “Pareto Chart is a specific type of histogram, ordered by frequency of occurrence.” It is used for showing how many defects are generate by a particular cause. This type of rank ordering is used to focus on corrective actions.
Run Chart: A run chart shows the history and pattern of variation. It shows trends in a process over time, variation, declines or improvements in a process over time. It is usually used to monitor technical, cost and schedule performance.
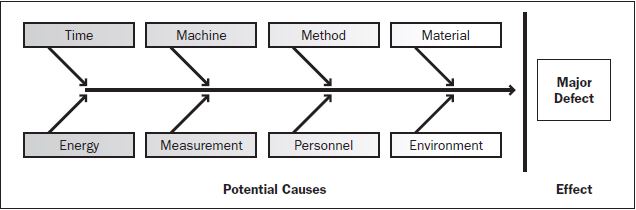
Cause and Effect (Ishikawa) Diagram
|
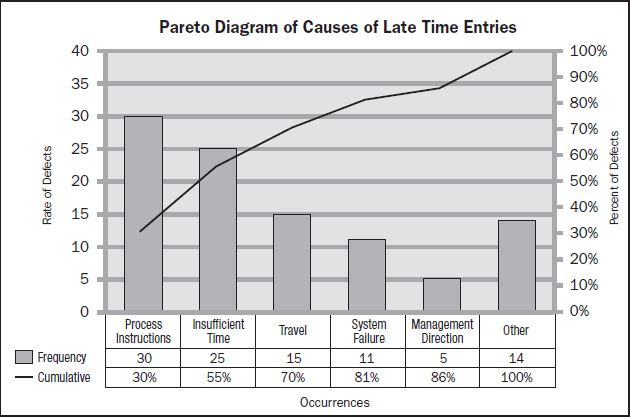
Pareto Diagram
|
